您所在的位置:首页 - 百科 - 正文百科
用spss做回归
![]() 祈晨
2024-05-07
【百科】
803人已围观
祈晨
2024-05-07
【百科】
803人已围观
摘要**Title:MasteringRegressionAnalysiswithSPSS**Regressionanalysisisapowerfulstatisticaltechniqueusedto
Title: Mastering Regression Analysis with SPSS
Regression analysis is a powerful statistical technique used to understand the relationship between a dependent variable and one or more independent variables. With SPSS (Statistical Package for the Social Sciences), conducting regression analysis becomes more accessible and efficient. Let's delve into the essentials of regression analysis with SPSS programming.
Introduction to Regression Analysis:
Regression analysis aims to model the relationship between a dependent variable (Y) and one or more independent variables (X). It helps in predicting the value of the dependent variable based on the values of independent variables.
Types of Regression in SPSS:
SPSS offers various types of regression analysis, including:
1.
Linear Regression:
It establishes a linear relationship between the dependent and independent variables.2.
Logistic Regression:
This is used when the dependent variable is categorical.3.
Multinomial Logistic Regression:
Useful for categorical dependent variables with more than two categories.4.
Ordinal Regression:
When the dependent variable is ordered categorical.SPSS Syntax for Regression Analysis:
Below is the syntax for conducting a simple linear regression analysis in SPSS:

```SPSS
REGRESSION
/MISSING LISTWISE
/STATISTICS COEFF OUTS R ANOVA
/CRITERIA=PIN(.05) POUT(.10)
/NOORIGIN
/DEPENDENT dependent_variable
/METHOD=ENTER independent_variable1 independent_variable2.
```
Explanation of Syntax:
MISSING LISTWISE:
This option tells SPSS to exclude cases with missing values.
STATISTICS:
Specifies the statistics you want to include in the output.
CRITERIA:
Sets the significance level for including or excluding variables.
DEPENDENT:
Specifies the dependent variable.
METHOD:
Specifies the method for including independent variables.Interpreting the Output:
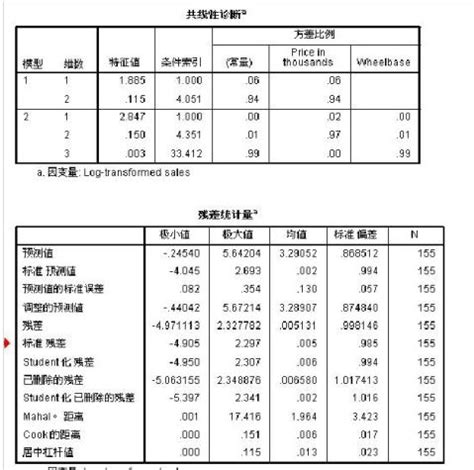
After running the regression analysis, SPSS provides output including:
1.
Coefficients Table:
It shows the coefficients for each independent variable, along with standard errors, tvalues, and pvalues.2.
Model Summary:
Provides information about the overall fit of the model.3.
ANOVA Table:
Displays the analysis of variance, including the Fstatistic and its significance level.Tips for Effective Regression Analysis with SPSS:
1.
Data Preparation:
Ensure your data is clean and formatted correctly before running the analysis.2.
Interpretation:
Understand the output thoroughly, including coefficients, significance levels, and model fit statistics.3.
Assumptions Checking:
Validate assumptions such as linearity, independence of errors, normality, and homoscedasticity.4.
Model Selection:
Consider using techniques like stepwise regression or regularization to select the most relevant variables.5.
CrossValidation:
Validate the model using techniques like crossvalidation to assess its predictive performance.Conclusion:
Mastering regression analysis with SPSS opens up a world of possibilities for researchers and analysts. By understanding the syntax, interpreting output, and following best practices, you can leverage the full potential of regression analysis to gain insights and make informed decisions.
References:
SPSS Documentation: [https://www.ibm.com/support/pages/node/535722](https://www.ibm.com/support/pages/node/535722)
Field, A. (2013). Discovering statistics using IBM SPSS statistics. Sage.
Hair, J. F., Black, W. C., Babin, B. J., & Anderson, R. E. (2019). Multivariate data analysis. Pearson.
Tags: 职业赛车手 小小梦魇2攻略 陈子豪解说我的世界 白马寺在哪个地区 联想y460驱动
版权声明: 免责声明:本网站部分内容由用户自行上传,若侵犯了您的权益,请联系我们处理,谢谢!联系QQ:2760375052
上一篇: 单片机编程语言流程图
下一篇: vb中1到100的和
最近发表
- 特朗普回应普京涉乌言论,强硬立场引发争议与担忧
- 民营企业如何向新而行——探索创新发展的路径与实践
- 联合国秘书长视角下的普京提议,深度解析与理解
- 广东茂名发生地震,一次轻微震动带来的启示与思考
- 刀郎演唱会外,上千歌迷的守候与共鸣
- 东北夫妻开店遭遇刁难?当地回应来了
- 特朗普惊人言论,为夺取格陵兰岛,美国不排除动用武力
- 超级食物在中国,掀起健康热潮
- 父爱无声胜有声,监控摄像头背后的温情呼唤
- 泥坑中的拥抱,一次意外的冒险之旅
- 成品油需求变天,市场趋势下的新机遇与挑战
- 警惕儿童健康隐患,10岁女孩因高烧去世背后的警示
- 提振消费,新举措助力消费复苏
- 蒙牛净利润暴跌98%的背后原因及未来展望
- 揭秘缅甸强震背后的真相,并非意外事件
- 揭秘失踪的清华毕业生罗生门背后的悲剧真相
- 冷空气终于要走了,春天的脚步近了
- 李乃文的神奇之笔,与和伟的奇妙转变
- 妹妹发现植物人哥哥离世后的崩溃大哭,生命的脆弱与情感的冲击
- 云南曲靖市会泽县发生4.4级地震,深入了解与应对之道
- 缅甸政府部门大楼倒塌事件,多名官员伤亡,揭示背后的故事
- 多方合力寻找失踪的十二岁少女,七天生死大搜寻
- S妈情绪崩溃,小S拒绝好友聚会背后的故事
- 缅甸遭遇地震,灾难之下的人间故事与影响深度解析
- 缅甸地震与瑞丽市中心高楼砖石坠落事件揭秘
- 揭秘ASP集中营,技术成长的摇篮与挑战
- 徐彬,整场高位压迫对海港形成巨大压力——战术分析与实践洞察
- ThreadX操作系统,轻量、高效与未来的嵌入式开发新选择
- 王钰栋脚踝被踩事件回应,伤势并不严重,一切都在恢复中
- 刘亦菲,粉色花瓣裙美神降临
- 三星W2018与G9298,高端翻盖手机的对比分析
- 多哈世乒赛器材,赛场内外的热议焦点
- K2两厢车,小巧灵活的城市出行神器,适合你的生活吗?
- 国家市监局将审查李嘉诚港口交易,聚焦市场关注焦点
- 提升知识水平的趣味之旅
- 清明五一档电影市场繁荣,多部影片争相上映,你期待哪一部?
- 美联储再次面临痛苦抉择,权衡通胀与经济恢复
- 家庭千万别买投影仪——真相大揭秘!
- 文物当上网红后,年轻人的创意与传承之道
- 手机解除Root的最简单方法,安全、快速、易操作
- 缅甸地震与汶川地震,能量的震撼与对比
- 2011款奥迪A8,豪华与科技的完美结合
- 广州惊艳亮相,可折叠电动垂直起降飞行器革新城市交通方式
- 比亚迪F3最低报价解析,性价比之选的购车指南
- 商业健康保险药品征求意见,行业内外视角与实用建议
- 官方动态解读,最低工资标准的合理调整
- 东风标致5008最新报价出炉,性价比杀手来了!
- 大陆配偶在台湾遭遇限期离台风波,各界发声背后的故事与影响
- 奔驰C级2022新款,豪华与科技的完美融合
- 大摩小摩去年四季度对A股的投资热潮


